Understanding Device Sensor Data
Interface Overview
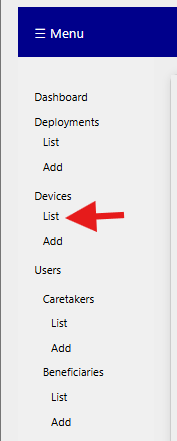
To view and analyze individual sensors, navigate to Devices in the sidebar and select List.
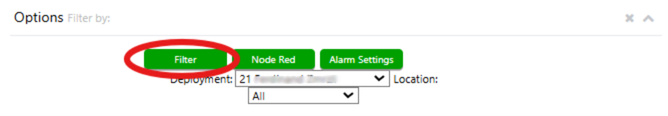
Next, use the top menu to select the desired deployment and sensor location. To update the display below, click the green Filter button on the right.
Then, navigate to the blue box on the lower right and click Devices in Deployment (Well ID's).
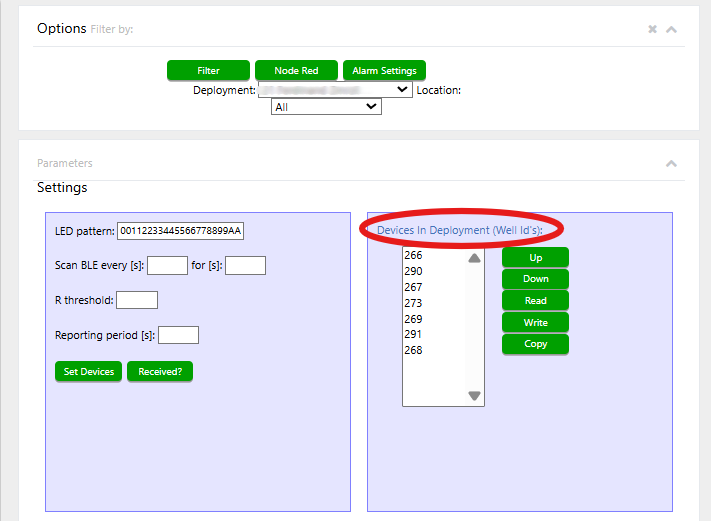
Note: A specific deployment and location must be selected before you can access data through this link.
Once completed, the following view will be displayed: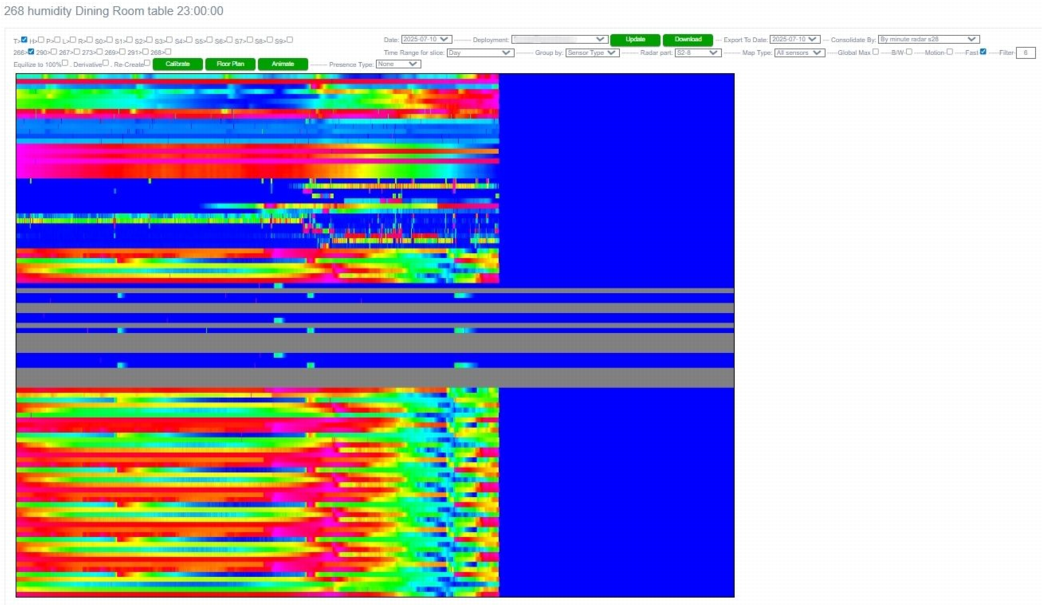
Sensor data is presented in two formats: graphical summaries and line graphs. The line graphs shown above are dynamically generated based on the filters you selected (e.g., deployment, location, and device). This section will explain how to interpret these visuals for different devices and their individual sensors within a deployment.
Each device includes the following sensors:
- Temperature
- Humidity
- Smell
- Light
- Air Pressure (used to detect door opening/closing events)
- RADAR (used for presence detection)
Additionally, each device features a multicolor LED light and Bluetooth/Wi-Fi radio for connectivity and signaling. All sensor outputs for the selected device will be displayed on this screen.
When the page first loads, it displays sensor data for all devices within a specific deployment and location, defaulting to the current date.
Each colored bar represents sensor readings recorded throughout the day. As the day progresses, the bars fill horizontally to reflect elapsed time. The color spectrum represents sensor value intensity:
- Blue indicates lower values
- Red indicates higher values
- Gray signifies a lack of sensor activity or detection
- Blue segments to the right of a bar represent the remaining portion of the day (i.e. time not yet recorded up to midnight)