WellNuo Mobile Application
Logging In
Basic Navigation
Dashboard Overview
Status Meter
Color Indicators
Dashboard Details View
Location Report
Reading and Interpreting Reports
Location Report Features
Activity Report
Activity Report Details
Activity Report Features
Radar Data Panel
Room Light Panel
CO2 Panel
Humidity Panel
Air Pressure Panel
Welcome to the WellNuo Mobile Application User Tutorial. This mobile platform connects directly to your configured deployments in the WellNuo Desktop Portal, allowing you to monitor and manage beneficiary activity in real time.
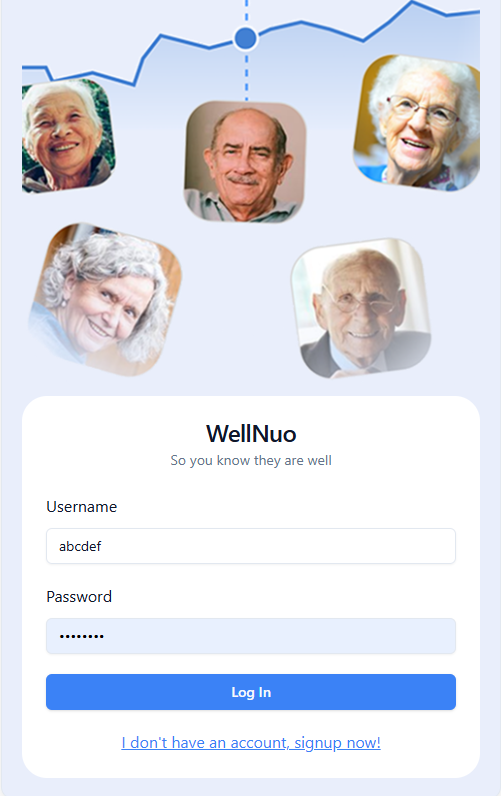
To log in, go to https://react.eluxnetworks.net/login and enter your credentials.
Basic Navigation
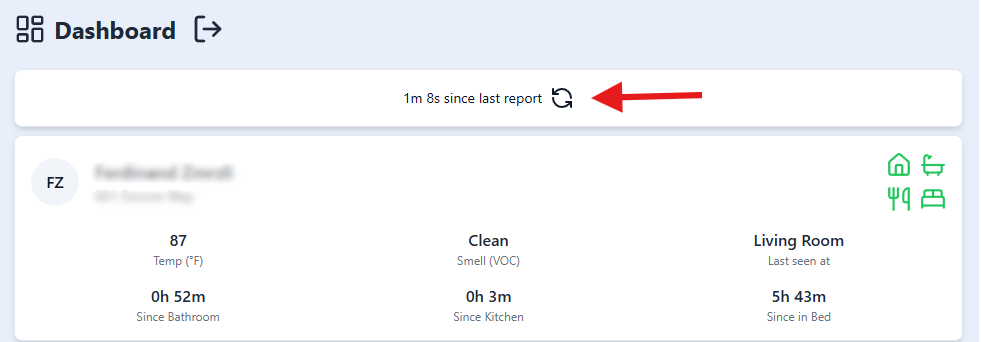
- Refreshing Data:
To refresh the dashboard data for all beneficiaries, tap the circular arrow icon located next to the text "[Time] since last report."
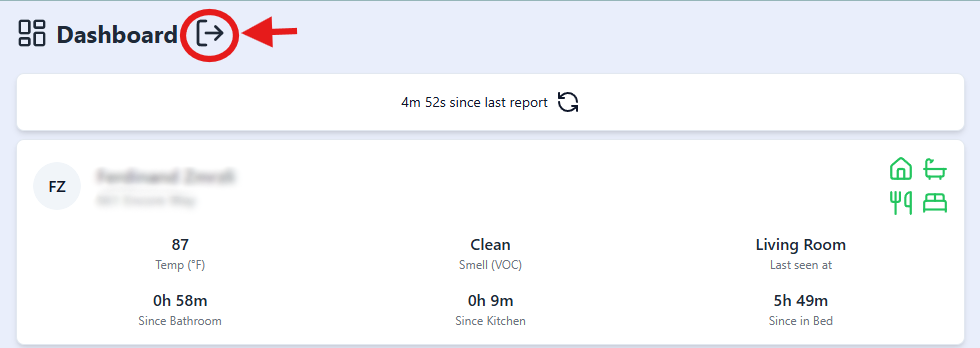
- Logging Out:
To log out of the application, press the Logout button located to the right of the text "Dashboard."
Dashboard Overview
After logging in, you will arrive at the Dashboard—a panel-based view listing all beneficiaries under your deployment.
Each beneficiary panel includes:
- Full Name
- Address
- Initials (top-left corner)
- Key Parameters:
- Temperature (°F)
- Smell Status (VOC)
- Last Seen Location
- Time Since Last Bathroom Use
- Time Since Last Kitchen Use
- Time Since Last Bedroom Use
Status Meter (Top-right Corner):
Four icons are shown, each with a color-coded status:
![]()
- House – Most recent location
- Bathtub – Time since bathroom use
- Fork and Knife – Time since kitchen use
- Bed – Time since bedroom use
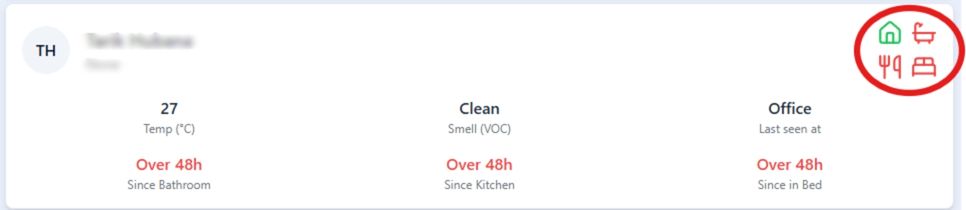
Color Indicators:
- Green: Normal activity
- Yellow: Warning – noticeable deviation from expected patterns
- Red: Alert – significant deviation
Note: Thresholds for alerts and warnings are configured in the WellNuo Desktop Application. For detailed setup instructions, refer to the "Using the Alarm System" section in the Developer and Webapp manual.
Dashboard Details View
By selecting a beneficiary’s panel, you’ll be taken to the Dashboard Details screen. This view includes all the data from the Dashboard plus the following detailed reports:
- Location Report
- Sleep Report
- Activity Report
- Radar Data
- Room Light
- Air Quality (CO₂)
- Temperature
- Humidity
- Air Pressure
These modules help you track behavioral and environmental data for each individual in a streamlined format.
Location Report
The Location Report uses bar graphs to display where a beneficiary spends time throughout each day.
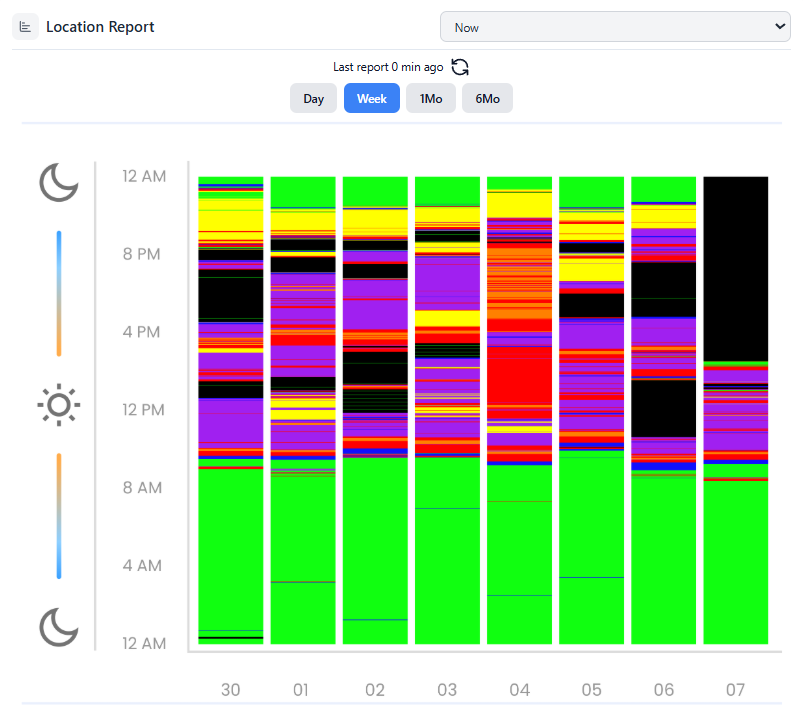
Graph Details:
- X-Axis: Day of the month
- Y-Axis: Time of day (12:00 AM at the bottom to 11:59 PM at the top)
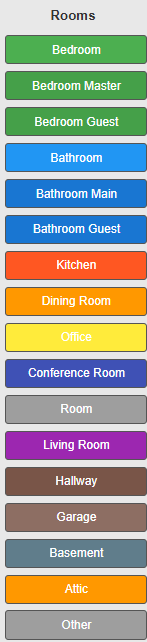
- Colors: Each color represents a different room/location
- Black: No recorded data for that time
- Refer to the Utilizing The Floor Plan Page in the WellNuo Desktop Application manual for the color legend
Features:
- Date Selector (Top Right): Choose “Now” for current data, or select past dates
- Graph Range Options: View a single day, week, month, or six months
- Refresh Button: Tap the circular arrow to load new data
- Room Usage Breakdown: Scroll down to see time spent in each room (available for Week, 1 Month, and 6 Month views)
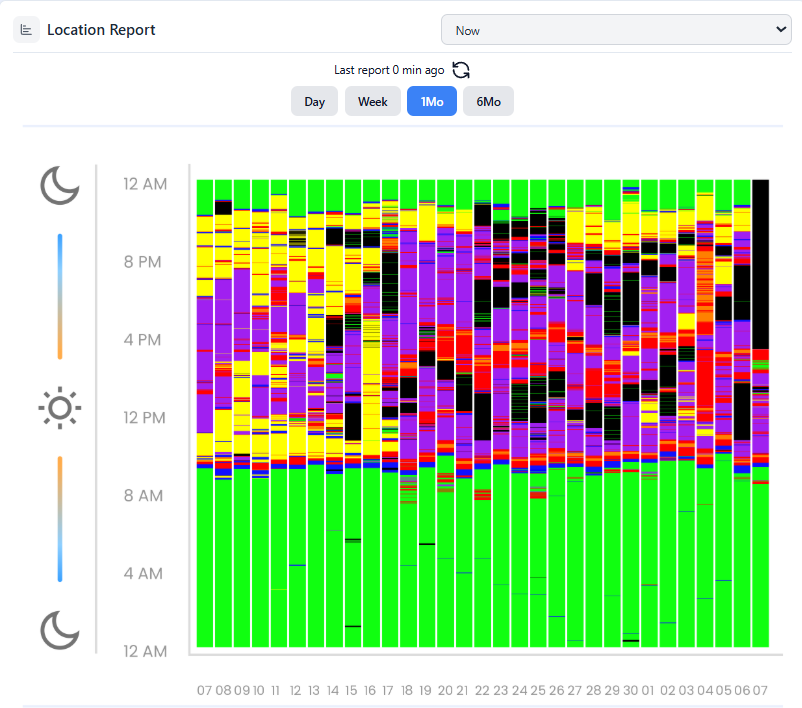
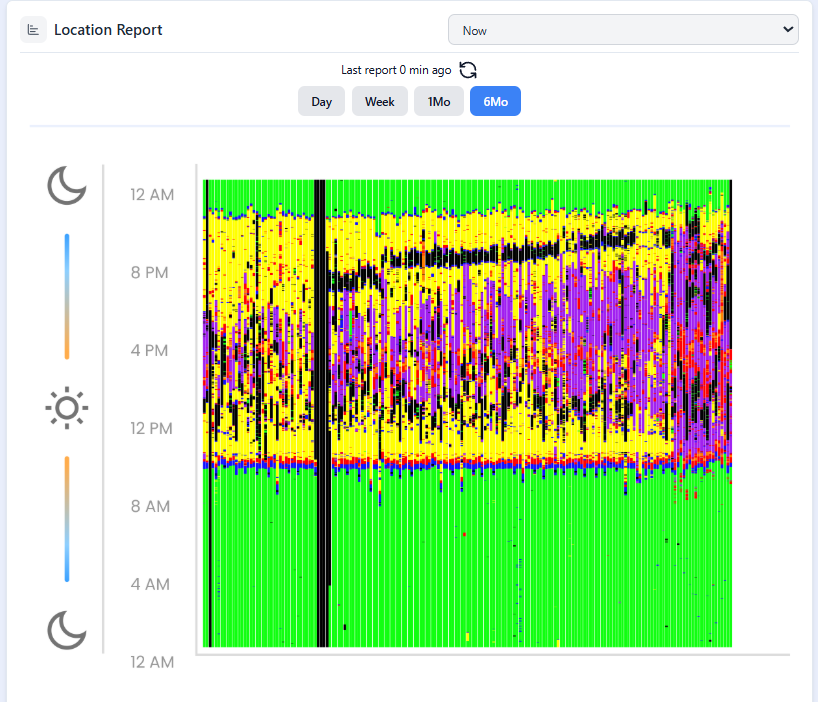
Note: Hover-based tooltips and exact numerical data are not currently supported in the mobile version.
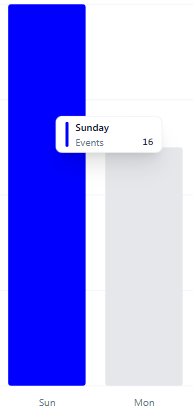
Activity Report
This module monitors presence in key residential zones: bedroom, bathroom, kitchen, and office.
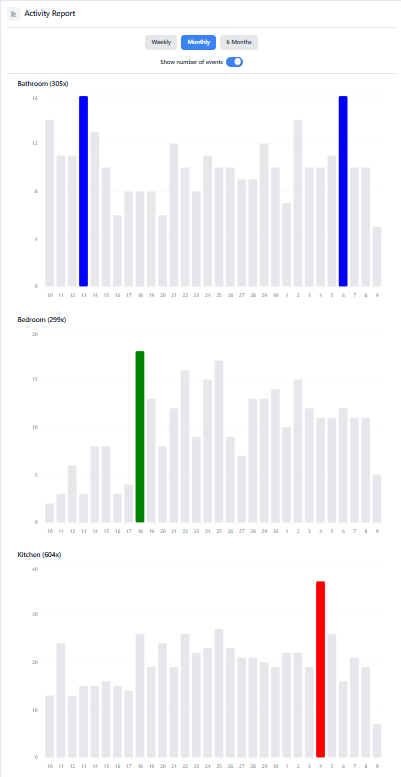
Graph Details:
- X-Axis: Days of the week (latest day appears on the right)
- Y-Axis:
- Number of visits (default)
- OR total time spent (toggle setting)
Settings & Options:
- “Show Number of Events” Toggle:
- On: Y-axis shows number of visits per day
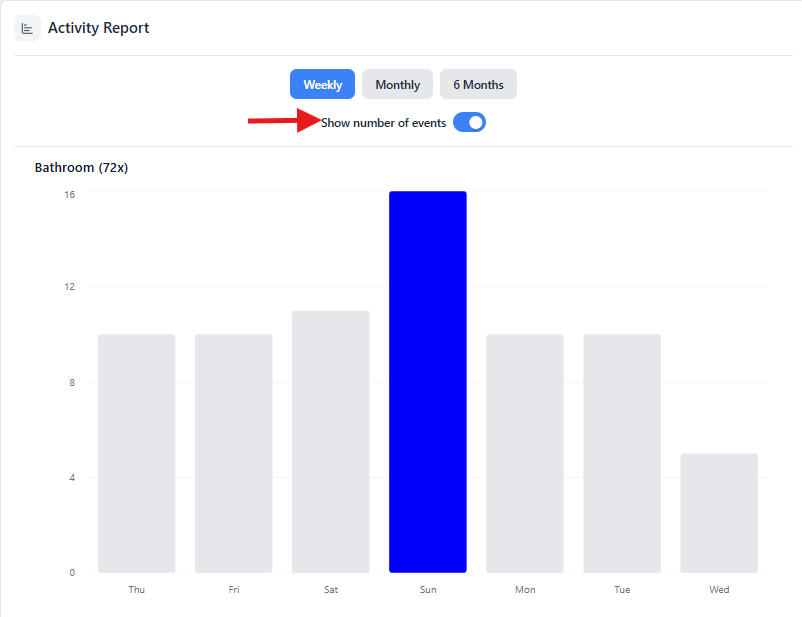
- Off: Y-axis shows total hours spent in each room
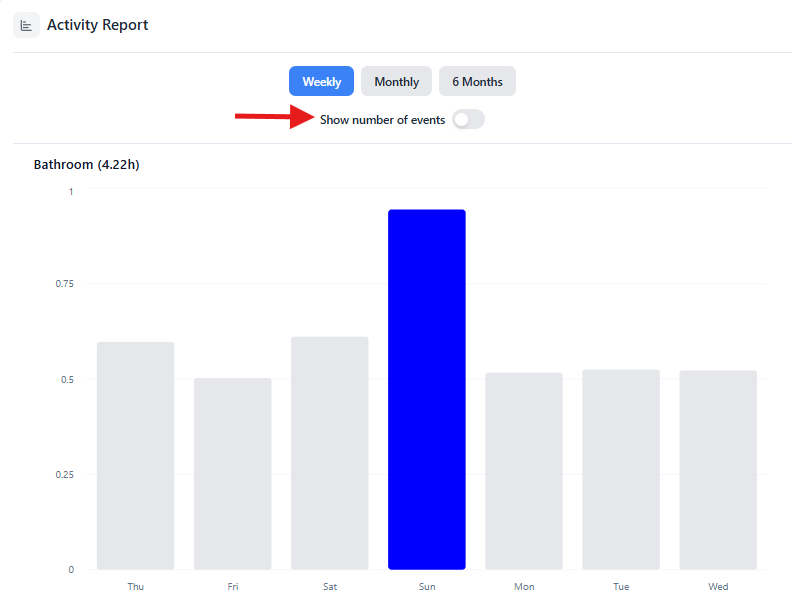
- Color Highlight: Highest activity day is marked with a colored bar
- Hover Functionality: Displays visit count and date
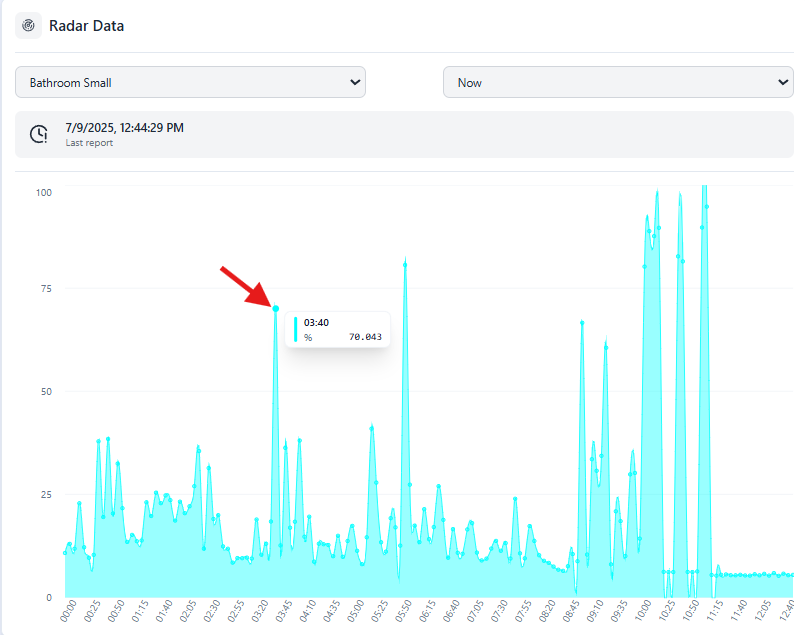
Radar Data Panel
Tracks motion or presence using radar signal strength.
- Y-Axis: Radar signal intensity (%)
- X-Axis: Time of day
- Drop-down Menus: Select room and date
- Hover: View timestamp and signal percentage. This applies to all following panels as well.
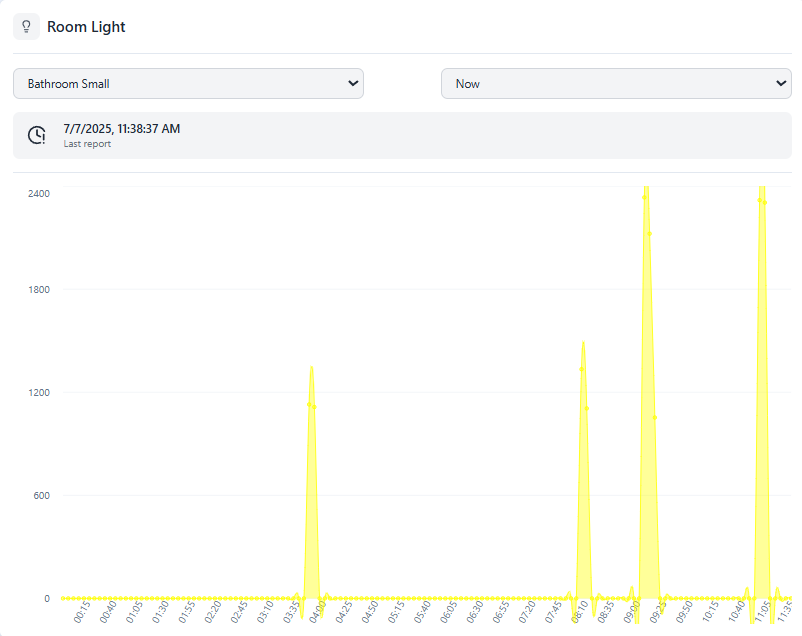
Room Light Panel
Measures lighting levels in a room over time.
- Y-Axis: Light intensity (Lux)
- X-Axis: Time of day
- Drop-down Menus: Select date and room
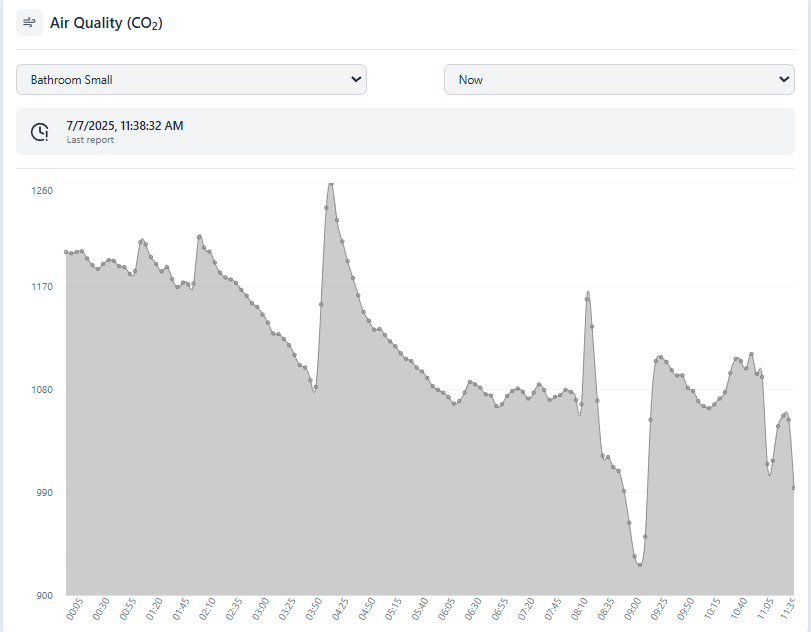
CO₂ Panel (Air Quality)
Tracks carbon dioxide concentration to assess air quality.
- Y-Axis: CO₂ level (PPM – parts per million)
- X-Axis: Time of day
- Drop-down Menus: Select date and room
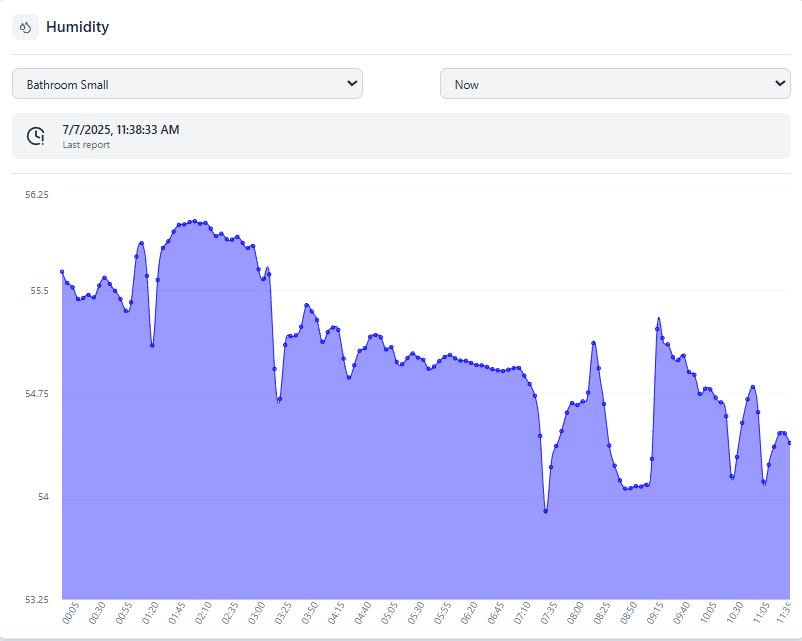
Humidity Panel
Displays relative humidity readings for each room.
- Y-Axis: Humidity (%)
- X-Axis: Time of day
- Drop-down Menus: Select date and room
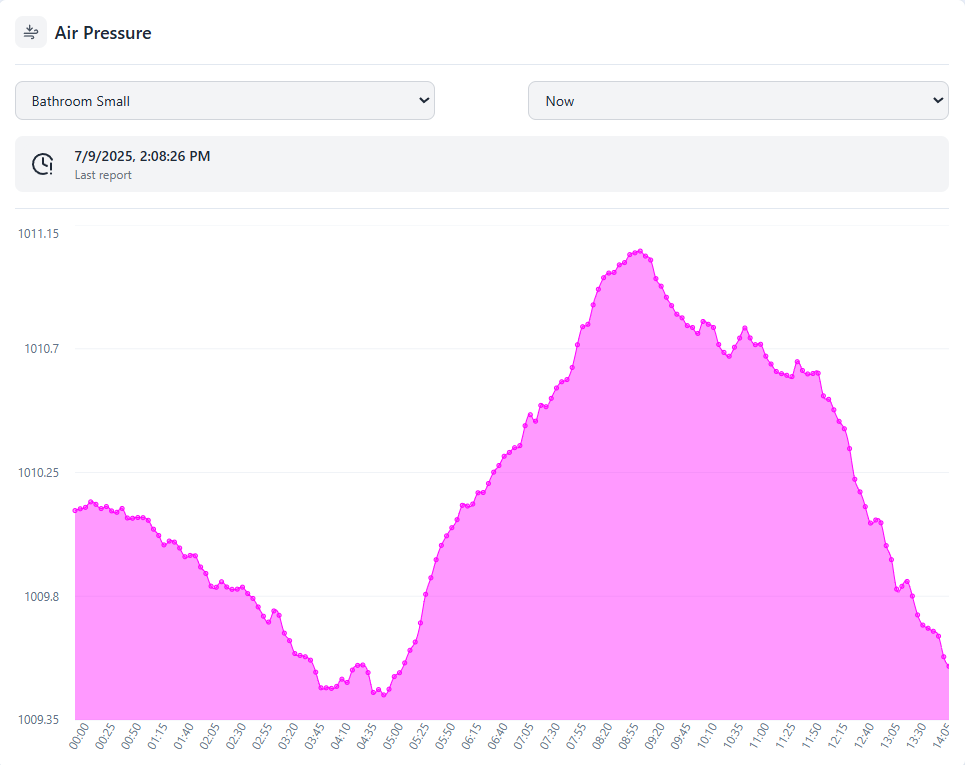
Air Pressure Panel
Monitors barometric pressure, which may indicate ventilation or door movement.
- Y-Axis: Air pressure (Bar)
- X-Axis: Time of day
- Drop-down Menus: Select date and room