Filter Line Graph Navigation And Interpretation
Graph Navigation and Interaction
- A line graph is displayed based on the selected filters.
- Pan: Right-click and drag the graph to navigate.
- Zoom In: Left-click and drag to the right to select a zoom area.
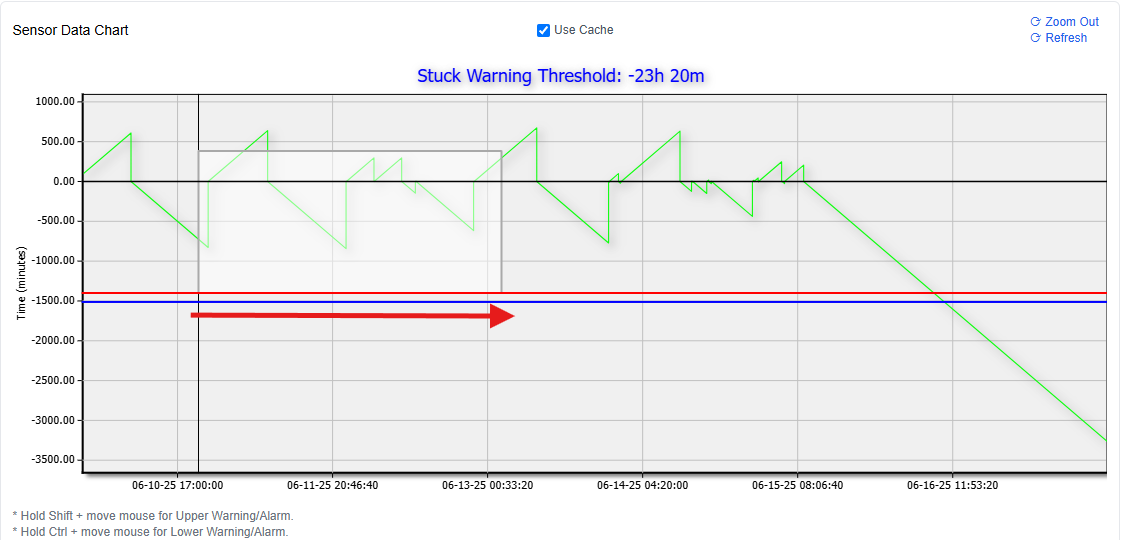
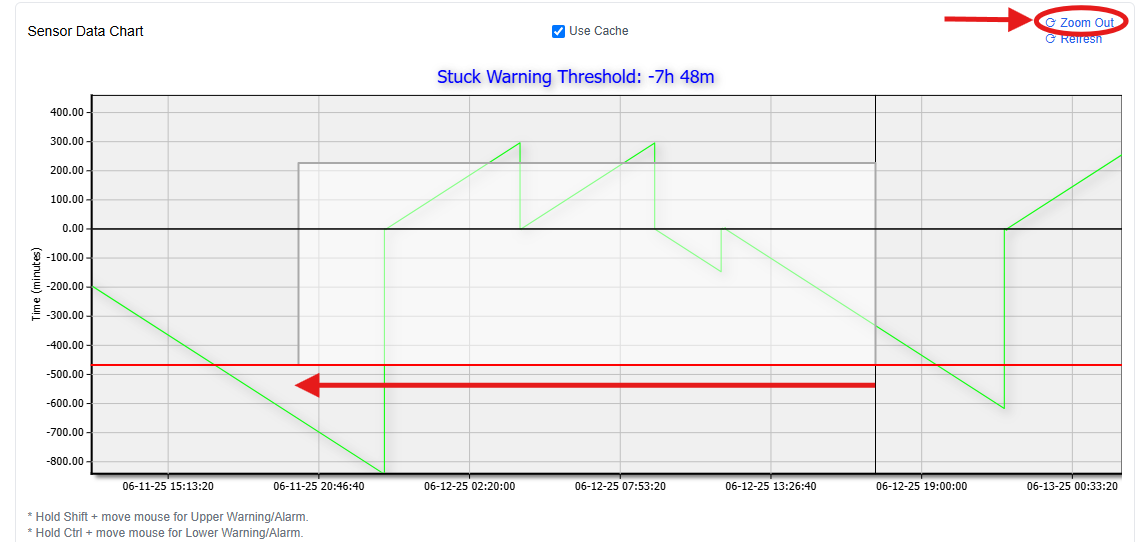
- Zoom Out: Left-click and drag to the left or use the blue Zoom Out button
Threshold Settings Table
At the center of the page, a table allows you to set thresholds for alert conditions. This is where you configure:
- Stuck: Indicates prolonged presence in a room.
- Absent: Indicates prolonged absence from expected areas.
- Temp Low / Temp High: Define minimum and maximum room temperature thresholds.
Each condition has two associated rows:
- Enabled: Arms the condition for alert monitoring.
- Triggered: Defines the response behavior when the condition is met.
To enable a condition:
- Click the corresponding box in the Enabled row.
- It will turn green and display the current threshold.
- The line graph below will update to reflect this selection.
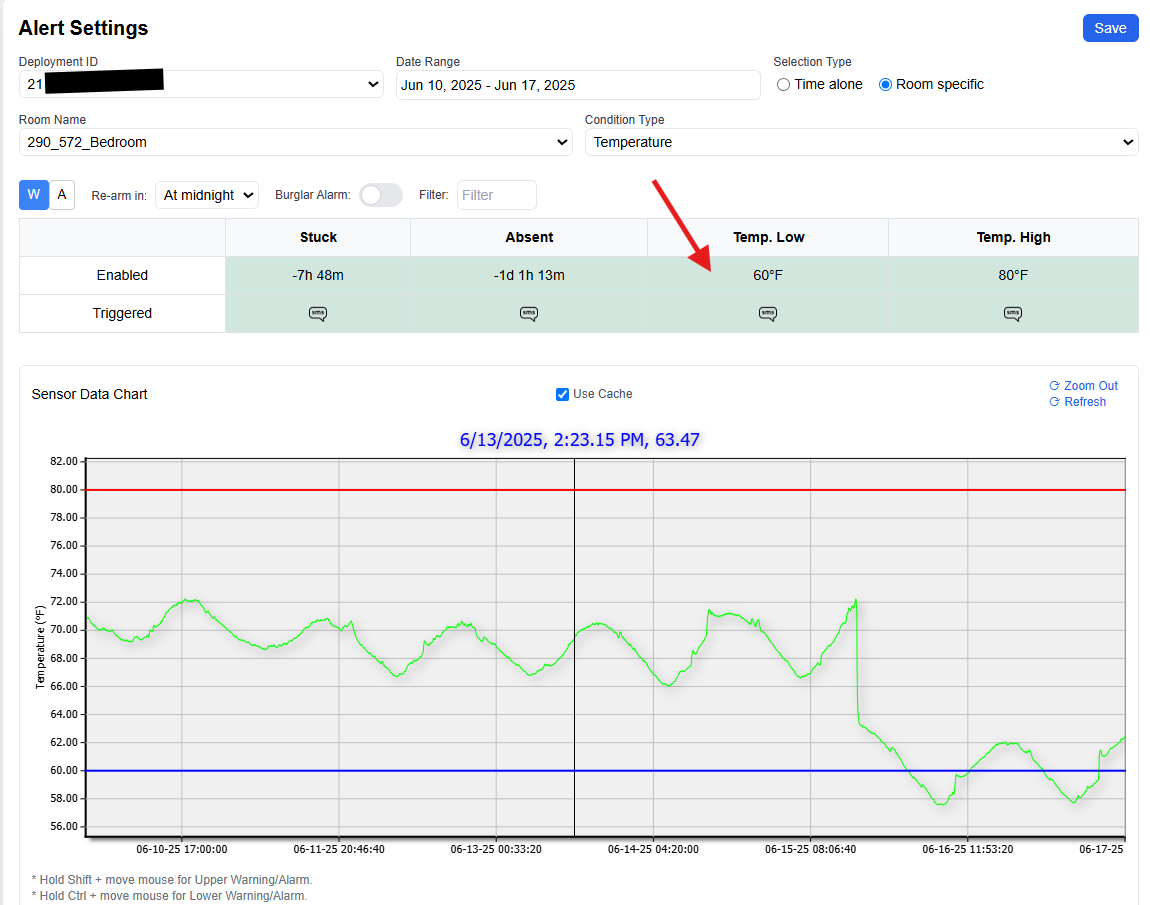
Sensor Condition Switching:
- Selecting Temp Low or Temp High will automatically switch the condition type to Temperature.
- Selecting Stuck or Absent will set the condition type to Presence/Absence.
Graph Interpretation & Threshold Adjustment
Graph Display:
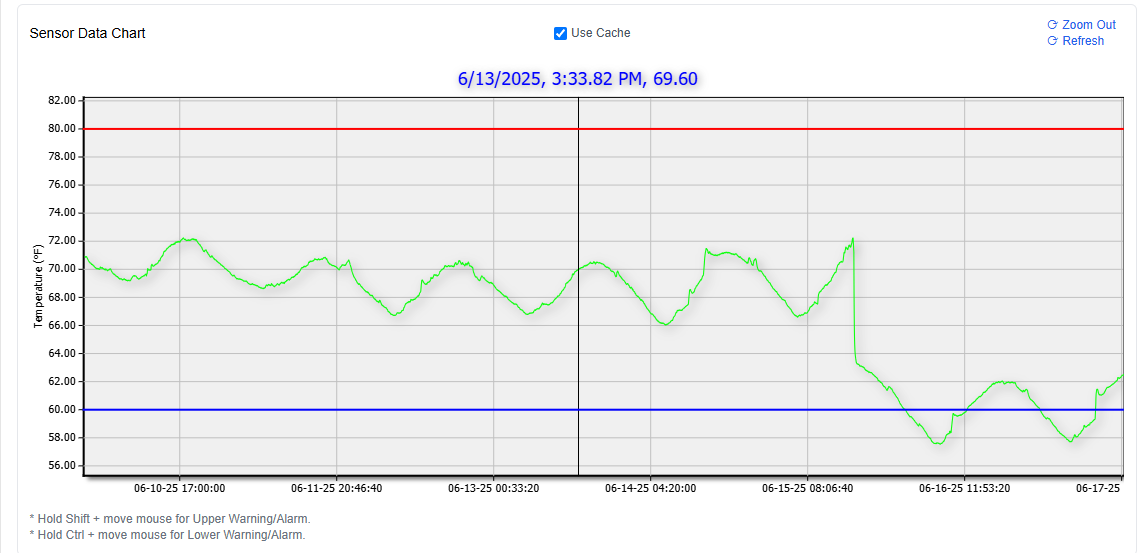
- Temperature Condition:
- X-axis: Date and time (24-hour format)
- Y-axis: Temperature in Fahrenheit
- Presence/Absence Condition:
- Y-axis: Time in minutes
- An ascending line graph indicates presence. Color of the line is representative of the room/location. In this instance, the bedroom is being monitored, represented by a green line.
- A descending line shows increasing time spent away.
- A vertical upwards/downwards jump back to zero signal return and departure respectively.
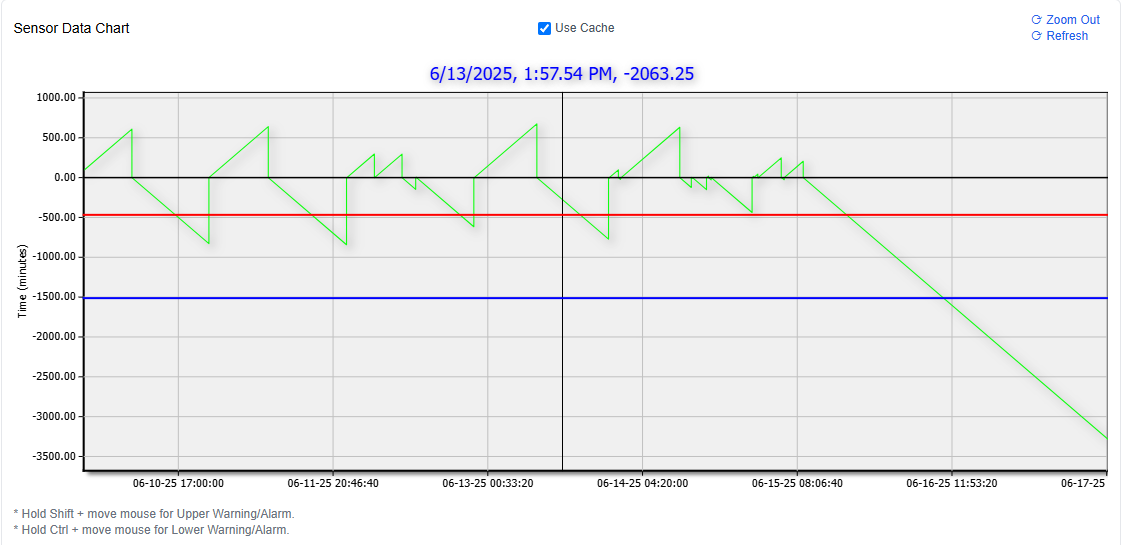
Setting Thresholds:
- Red Line = Upper threshold
- Hold Shift and drag mouse vertically.
- Blue Line = Lower threshold
- Hold Ctrl and drag mouse vertically.
- To Modify: Hover over the line and repeat the above steps to adjust.