Interacting With Sensor Data Graphs
Interacting With the Graph
To view detailed information for a specific data bar, simply hover your mouse over it. A tooltip will appear showing the sensor type, location, device number, and MAC address associated with that data point.
Interacting with the Line Graph
At the bottom of the display, you will find the line graph, which provides a more detailed view of individual sensor data.
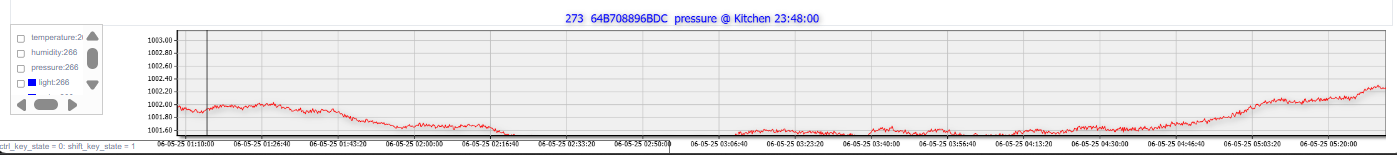
Viewing a Specific Sensor
To analyze a specific sensor in greater detail:
- Hover your mouse over the corresponding bar in the heatmap.
- While holding the Ctrl key, left-click the bar.
- The related line graph will appear below, displaying data for that sensor.
- The Y-axis represents sensor values.
- The X-axis shows the corresponding date and time.
- To pan, right click and drag the graph to the desired location.
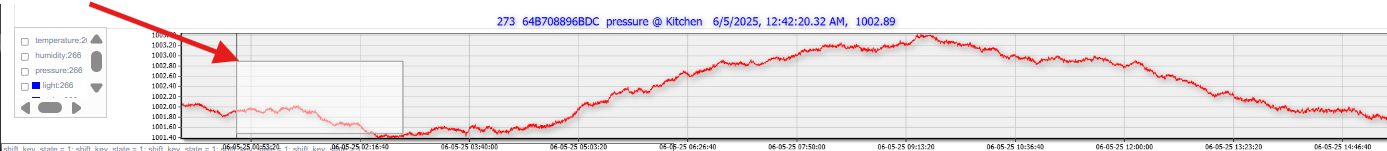
Zooming In and Out
- To zoom in on a specific section of the graph:
- Left-click and drag to the right across the desired area.
- A selection box will appear.
- Release the mouse to zoom into that segment.
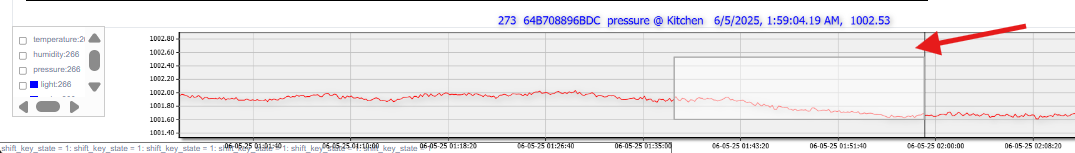
- To zoom out:
- Left-click and drag to the left across any portion of the graph.
- A selection box will again appear.
- Release the mouse to return to the broader view.
Sensor Selection Panel
To the left of the line graph, you'll find a panel that allows you to manually check or uncheck specific sensors for analysis. Each entry includes:
- The device number or room name
- The sensor type
- A colored square indicating that sensor’s corresponding line on the graph
Note: A "Select All/None" feature is not currently available.
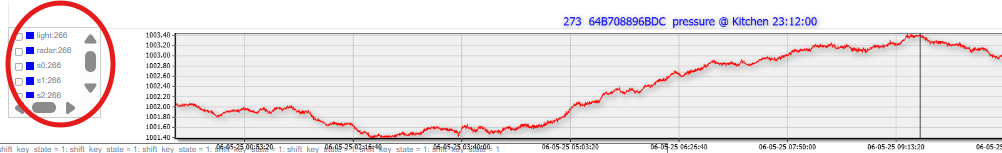
This panel allows for tailored analysis of data across multiple sensors and devices.